Windows Prefetch Files
In this article, we’ll take a closer look at Prefetch files in Windows 11 and the data that can be derived from these files.
In this article, we’ll take a closer look at Prefetch files in Windows 11 and the data that can be derived from these files.
Prefetch files can help determine which applications were executed, how frequently they were executed, and which files they interacted with. Prefetch files can support event reconstruction, reveal suspicious execution paths, and corroborate findings from other forensic sources.
What are Prefetch files?
Prefetch files are performance‑enhancing artifacts created by Windows when an application runs for the first time. They are stored with a .pf extension and contain historical data intended to optimize the launch time of frequently used programs.
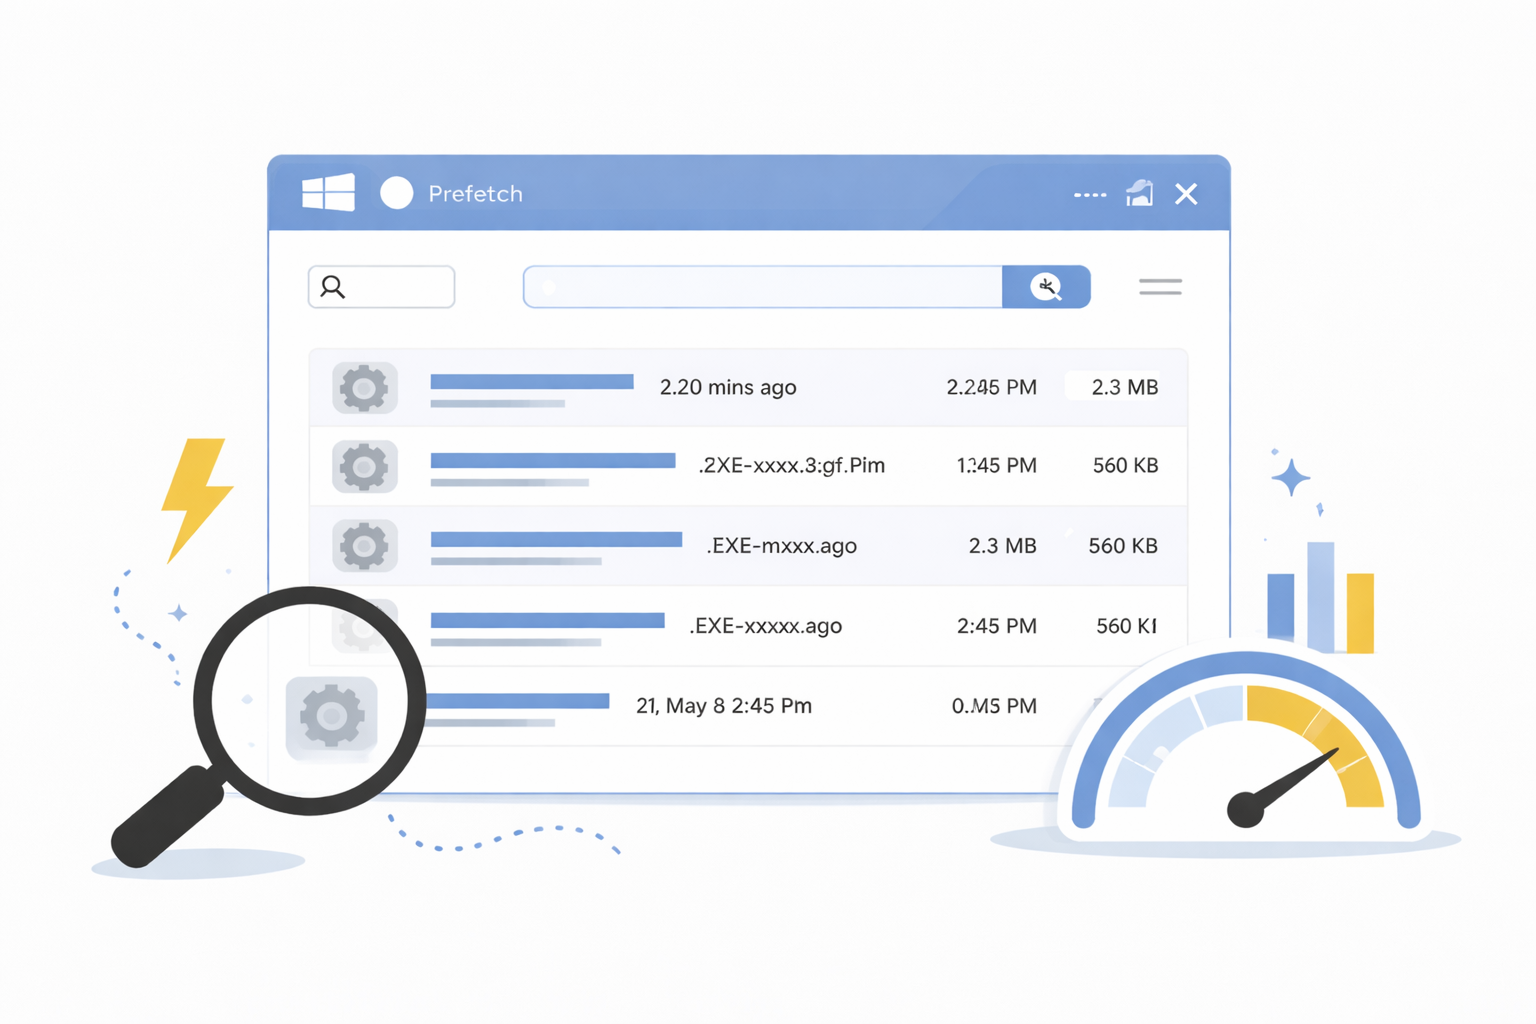
 Fig.1 Zoom Prefetch File
The naming format follows:
<APPLICATION_NAME>-<HASH>.pf
For example: ZOOM.EXE-C75F1ED7.pf
The 8 character hash value is based on the location from where the executable was located when executed. Also a combination of the location and the command line arguments could be used to create the hash.
Data
Each Prefetch file contains metadata such as:
- The name of the executable
- A hash derived from the executable’s full path
- First and last execution timestamps
- Up to eight historical run timestamps (Windows 8 and later)
- A list of files and directories referenced by the application
For example, the PECmd output of ZOOM.EXE-C75F1ED7.pf:
1
2
3
4
5
6
7
8
9
10
11
12
13
14
15
16
17
18
Created on: 2025-07-09 18:03:41
Modified on: 2026-01-17 19:26:28
Last accessed on: 2026-02-20 20:26:42

Executable name: ZOOM.EXE
Hash: C75F1ED7
File size (bytes): 348.956
Version: null

Run count: 7
Last run: 2026-01-17 19:26:27
Other run times: 2026-01-17 19:26:22, 2026-01-17 18:36:20, 2026-01-17 18:36:17, 2025-07-09 19:04:46, 2025-07-09 18:03:43, 2025-07-09 18:03:40

Directories referenced: 43
[...]

Files referenced: 299
[...]
Windows uses this information to load necessary resources more efficiently during future executions.
The creation time is the time the file was created, and when the application was executed for the first time (when the Prefetch files aren’t removed before this execution).
The modified time is the time the file was last modified, and is an indication for the last execution time of the application.
Timedelta
Since it takes about 10 seconds for the Prefetch process to run, the Prefetch timestamps are accurate up to 10 seconds.
Where Are Prefetch Files Located?
Prefetch files are saved in C:\Windows\Prefetch\
This folder is available on Windows workstations, where Prefetching is enabled by default. Windows 11 stores up to 1024 Prefetch files, removing older entries as new ones are generated, first in first out.
Tools for parsing Prefetch data
Several forensic tools can extract and interpret Prefetch metadata, among others PECmd.
WinPrefetchView
https://www.nirsoft.net/utils/win_prefetch_view.html
GUI utility by NirSoft. Parses the Prefetch files into columns.
Windows Prefetch Parser
https://tzworks.com/prototype_page.php?proto_id=1
Command line tool made by TZWorks. Can be used to read a Prefetch file, or convert it into a CSV file.
Example usage:
pf64 "C:\Windows\Prefetch\ZOOM.EXE-C75F1ED7.pf" -csv output
Parsed output can then be imported into Timeline Explorer for filtering and comparison.
PECmd
https://github.com/EricZimmerman/PECmd
Eric Zimmerman’s PECmd is widely used to convert .pf files into human‑readable reports or CSV output. It extracts all metadata fields, including timestamps, run counts, and file‑access lists.
Example usage:
PECmd.exe -f "C:\Windows\Prefetch\ZOOM.EXE-C75F1ED7.pf" --csv Output
Parsed output can then be imported into Timeline Explorer for filtering and comparison.
Timeline Explorer
https://ericzimmerman.github.io
Once Prefetch data is parsed into CSV, Timeline Explorer helps sort, filter, and visualize activity patterns. It is especially useful for spotting anomalies or correlating events with other system artifacts.
Interpreting Traces in Prefetch Files
Prefetch files contain multiple categories of forensic evidence. Understanding each category is key to leveraging them effectively.
Execution Timestamps
Prefetch stores:
- First recorded execution time
- Last execution time
- Up to eight previous run timestamps
These timestamps help build precise timelines, especially when correlated with other forensic sources. These times should however be interpreted in a 0 to 10 second range.
Run Count
The number of times an application ran can point to repetitive malicious execution, automated tasks, or frequent user activity.
File/Directory Access Lists
These lists reveal:
- Supporting DLLs
- Configuration files
- Scripts or payloads the program interacted with
This insight can help investigators track secondary actions, such as unpacking malware or accessing sensitive data.
Suspicious Path Indicators
If Prefetch hashes indicate execution from temporary directories, user‑writable locations, or unexpected paths, this may signal malicious behavior or tool staging.
Registry Key
Prefetch is disabled by default on Windows Server Operation Systems. This can be checked in the Entrytype of SYSTEM\CurrentControlSet\Control\Session Manager\Memory Management\PrefetchParameters\EnablePrefetcher.
- Entry value 0 means that prefetching is disabled
- Entry value 1 means that only application launch prefetching is enabled.
- Entry value 2 means that only Boot prefetching is enabled.
- Entry value 3 means that both application launch and boot prefetching is enabled.
Entry value 3 is the default value.
Conclusion
Prefetch files are a powerful source of forensic evidence, especially when dealing with application execution analysis. They provide key insights about when a program ran, how often it executed, and which system resources it interacted with. Combined with other artifacts like AmCache, ShimCache, Event Logs, and network data, Prefetch files contribute to a understanding of system activity.
While Prefetch alone cannot explain the full scope of an incident, it offers added value when creating activity timelines or examining suspicious executables.